Characteristics of platelet-associated parameters and their predictive values in Chinese patients with affective disorders - BMC Psychiatry - BMC Psychiatry
Comparison of variables between patients with affective disorders and healthy controls
In this study, 14,007 patients with affective disorders and 6,847 healthy controls were enrolled for the final analysis. There were no differences found in age or sex between the affective disorders group and HC group (P > 0.05).
The ANCOVA analysis showed that after adjusting for age and sex, the affective disorders group showed lower platelet, neutrophil and lymphocyte counts (P < 0.05), and lower PDW, PCT and albumin (P < 0.05) than the HC group. The values of MPV, RDW and RPR in the affective disorders group were significantly higher than those in the HC group (P < 0.05). No significant differences were found in the PLR, SII and PAR values between the groups (P < 0.05). The data are shown in Table 1.
Comparison of variables among MDD, BD and healthy controls
A total of 8,899 MDD patients and 5,108 BD patients were included in the present study. ANOVA showed that the differences in age among the MDD, BD and HC groups were stastistically significant (F = 211.320, P < 0.001). Post hoc analysis rendered that the BD group was younger than the MDD group and the HC group, the MDD group was older than the HC group (P < 0.05) in the present study. Chi-square analysis showed that the BD group had an increased male/female ratio compared with the MDD group and the HC group, the MDD group had a decreased male/female ratio compared with the HC group (χ2 = 342.416, P < 0.001).
The ANCOVA showed that significant differences were found in the platelet, neutrophil and lymphocyte counts, and in the MPV, PDW, PCT, RDW, albumin, PLR, SII and RPR among the three groups (P < 0.05), there was no difference found in the PAR among the three groups (P > 0.05). Further post hoc analysis showed that compared to the HC group, the BD group had higher MPV, neutrophil, RDW, SII and RPR values (P < 0.05), and lower platelet counts, PDW, PCT, albumin, PLR values (P < 0.05). Compared to the HC group, the MDD group showed higher MPV, RDW, PLR and RPR values (P < 0.05), and lower platelet, PDW, PCT, neutrophil, lymphocyte, albumin and SII values (P < 0.05). Compared with the MDD group, the BD group exhibited higher MPV, PCT, neutrophil counts, lymphocyte counts, albumin levels and SII values (P < 0.05), and lower platelet counts, RDW and PLR values (P < 0.05). The data are shown in Table 2.
Comparison of variables among first-episode MDD, recurrent MDD and healthy controls
The present study included 4,801 patients with first-episode MDD and 4,098 patients with recurrent MDD. The recurrent MDD group was older than the first-episode MDD group and the HC group, and the first-episode MDD group was younger than the HC group (F = 343.082, P < 0.001) in the present study. The Chi-square test rendered that the male/female ratio in the first-episode MDD group was lower than the HC group, the male/female ratio in the recurrent MDD group was lower than both the first-episode MDD group and the HC group (χ2 = 97.951, P < 0.001).
After adjusting for age and sex, the ANCOVA analysis demonstrated statistically significant differences in the platelet, MPV, PDW, PCT, neutrophil, lymphocyte, RDW, albumin, PLR, SII and RPR values among the three groups (P < 0.05). Post hoc tests revealed that both the first-episode MDD group and the recurrent MDD possessed increased MPV, RDW, PLR and RPR values(P < 0.05), and decreased platelet, PDW, PCT, neutrophil, lymphocyte and albumin levels (P < 0.05) compared with the HC group. The first-episode MDD group had lower SII than HC group (P < 0.05), while the recurrent MDD group had no difference in SII compared to th HC group (P > 0.05). Compared to the first-episode MDD group, the recurrent MDD group presented with higher neutrophil counts and lower albumin levels (P < 0.05). The data are shown in Table 3.
Comparison of variables among BD manic episodes, BD depressive episodes and healthy controls
A total of 3,444 patients with BD manic episodes and 1,664 patients with BD depressive episodes were recruited in the study. The comparison of age showed that both the BD manic episodes group and the BD depressive episodes group had lower age than the HC group (P < 0.05), while there was no difference in age between the two BD groups (P > 0.05). Comparison of sex showed that the male/female ratio was higher in the BD manic episodes group and the BD depressive episodes group than in the HC group (P < 0.05), no difference was noted between the two BD groups (P > 0.05).
The results displayed that the three groups had significant differences in platelet counts, MPV, PDW, PCT, neutrophil counts, RDW, albumin levels, PLR, SII, RPR and PAR values (P < 0.05). Further post hoc tests revealed that when compared to the HC group, both the BD manic episodes group and the BD depressive episodes group had increased MPV, RDW, and RPR values (P < 0.05), and decreased platelet counts, PDW, PCT, albumin and PLR values (P < 0.05); furthermore, the BD manic episodes group showed higher neutrophil counts and SII values than the HC group (P < 0.05) when BD depressive episodes group had no differences in neutrophil, SII with HC group (P > 0.05). Comparison with the BD depressive episodes group showed that the platelet counts, MPV, PCT, neutrophil counts, SII and PAR values were elevated (P < 0.05), and the albumin levels and RPR values were decreased (P < 0.05) in the BD manic episodes group. The data are shown in Table 4.
MDD vs. BD depressive episodes and BD manic episodes
Comparison of age presented that age in the MDD group was higher than that in the BD depressive episodes group and the BD manic episodes group (F = 181.395, P < 0.001). The MDD group had a lower male/female ratio than the two BD groups (χ2 = 345.263, P < 0.001).
After adjusting for age and gender, ANCOVA revealed statistically significant differences in platelet counts, MPV, PCT, neutrophil counts, lymphocyte counts, RDW, albumin, PLR, SII, RPR and PAR values (P < 0.05) among the three groups. Post hoc tests showed that after adjusting for age and sex, the MDD group possessed higher platelet counts, RDW, PLR and PAR values (P < 0.05), and lower MPV, neutrophil counts and lymphocyte counts (P < 0.05) than the BD depressive episodes group. When compared to the BD manic episodes group, the RDW and PLR values in the MDD group were increased (P < 0.05), the MPV, PCT, neutrophil counts, lymphocyte counts, albumin and SII values in MDD group were decreased (P < 0.05). The BD manic group had the highest MPV, PCT, neutrophil counts and SII values of the three groups, and the MDD group had the highest RDW and PLR of the three groups. The data are shown in Table 5.
Comparison of haematological parameters between males and females
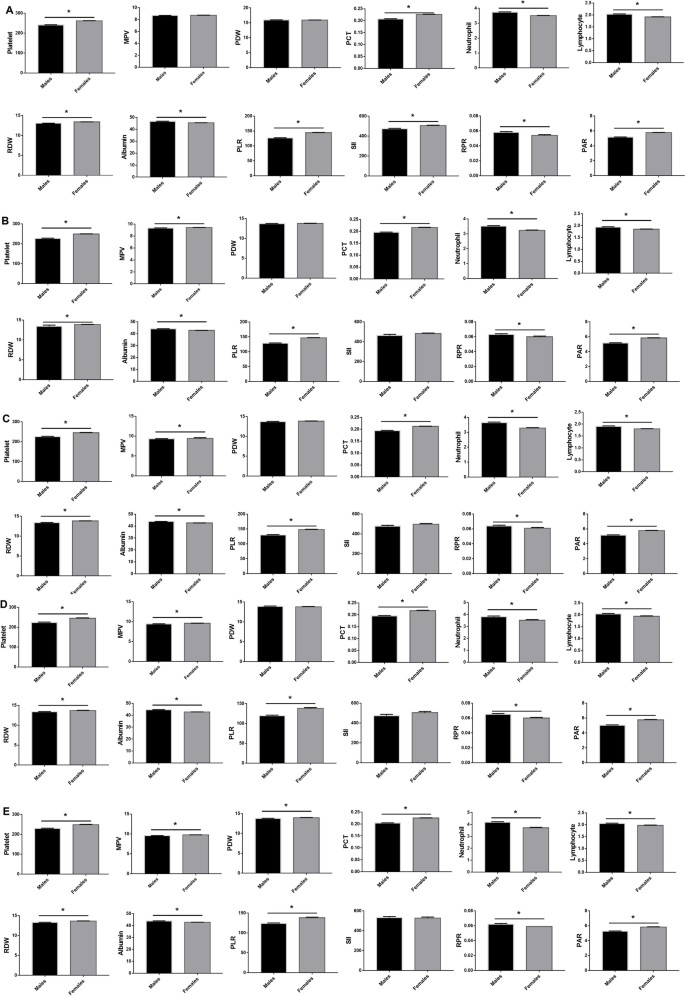
We also analysed differences in haematological parameters between males and females. In the HC group, there were 2,863 males and 3,984 females, the males presented higher neutrophil counts, lymphocyte counts, albumin and RPR values (P < 0.05), and lower platelet counts, PCT, RDW, PLR, SII and PAR values (P < 0.05) than females. The data are shown in Fig. 1A.

Comparison of haematological parameters between males and females in HC group A, first-episode MDD group B, recurrent MDD group C, BD depressive episodes group D and BD manic episodes group E. Data are represented as the mean ± SEM; *, vs. Female group, P < 0.05; HC, healthy controls; MDD, major depressive disorder; BD, bipolar disorder
There were 1,868 males and 2,933 females in the first-episode MDD group. The males showed higher neutrophil, lymphocyte, albumin and RPR values (P < 0.05), and lower platelet, MPV, PCT, RDW, PLR and PAR values (P < 0.05) than the females. The data are shown in Fig. 1B.
The recurrent MDD group included 1,325 males and 2,773 females. Comparison of blood test parameters between males and females in the recurrent MDD group revealed that the neutrophil, lymphocyte, albumin and RPR values were increased (P < 0.05), and the platelet, MPV, PCT, RDW, PLR and PAR values were decreased (P < 0.05) in males compared to those in females The data are shown in Fig. 1C.
In the BD depressive episodes group, 836 males and 823 females were included. The comparison showed that the neutrophil, lymphocyte, albumin and RPR values in males were higher than those in females (P < 0.05), The values of platelet, MPV, PCT, RDW, PLR and PAR values in males were lower than those in females (P < 0.05). The data are shown in Fig. 1D.
There were 1,815 males and 1,629 females in the BD manic episodes group. When compared to the females, the males in the BD manic episodes group presented higher neutrophil, lymphocyte, albumin and RPR values (P < 0.05), and lower platelet, MPV, PDW, PCT, RDW, PLR and PAR values (P < 0.05). The data are shown in Fig. 1E.
Correlations between haematological parameters and age
Spearman correlation analysis was used to test the correlations between the haematological parameters and age in the HC group and the diagnostic groups. In the HC group, the PDW, neutrophil, RDW, SII and RPR values were positively correlated with age (P < 0.05), the platelet, MPV, PCT, lymphocyte, albumin and PAR values were negatively correlated with age (P < 0.05).
In the first-episode MDD group, the Spearman correlation analysis showed that there were positive relationships between PLR, SII, RPR values and age (P < 0.05), there were negative relationships between platelet, MPV, PDW, PCT, lymphocyte, albumin values and age (P < 0.05).
In the recurrent MDD group, the PLR, SII and RPR values were positively correlated with age (P < 0.05), platelet, MPV, PDW, PCT, neutrophil, lymphocyte, albumin, and PAR values were negatively correlated with age (P < 0.05).
In the BD depressive episodes group, the Spearman correlation analysis revealed that the PLR, SII and RPR had positive correlations with age (P < 0.05), but platelet, MPV, PCT, lymphocyte and albumin values had negative correlations with age (P < 0.05).
In the BD manic episodes group, the PLR and RPR values were positively correlated with age (P < 0.05), and the platelet, MPV, PCT, neutrophil, lymphocyte and albumin values were negatively correlated with age (P < 0.05). The data are shown in Table 6.
The haematological parameter predictors of the diagnosis of MDD or BD
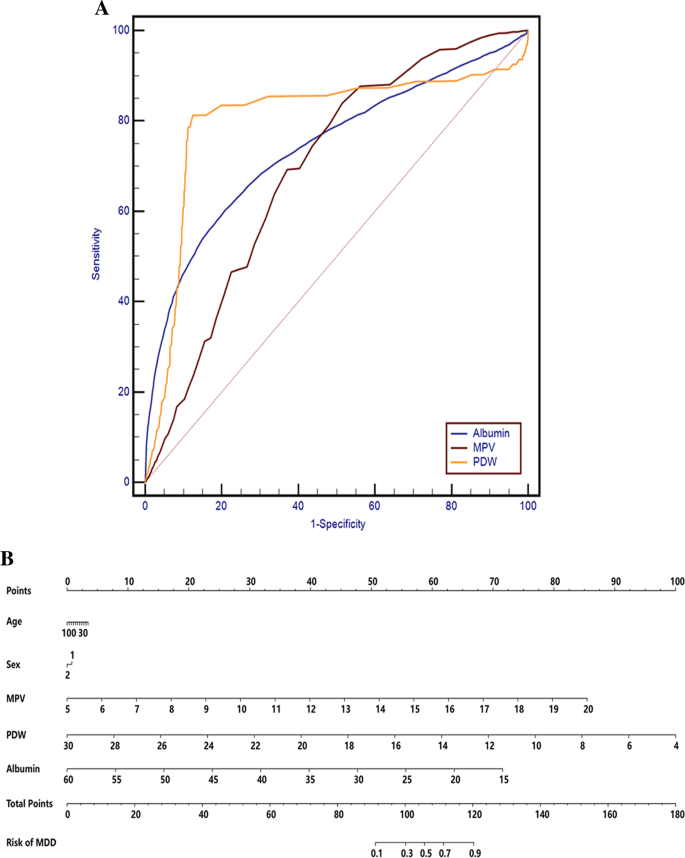
Based on the ROC curve analysis for the diagnosis of MDD, the parameters with an area under curve (AUC) higher than 0.7 were the PDW and albumin, the AUC of MPV was close to 0.7, the AUC of other parameters were lower than 0.6. The PDW cut-off point of 15.5% which showed 81.16% sensitivity and 87.62% specificity, and with the AUC 0.804 (95% CI: 0.791–0.810) was the optimal cut-off point for the identification of MDD. Albumin cut-off point of 43.8 g/L which displayed 60.24% sensitivity and 79.11% specificity, and with the AUC 0.742 (95% CI: 0.735–0.749) was the optimal cut-off point for identification of MDD. Furthermore, 8.4 fL as a cut-off value for MPV differentiated patients with MDD from healthy controls with a sensitivity of 83.91% and a specificity of 48.55% (AUC: 0.693, 95%CI: 0.686–0.701, P < 0.001). The data are shown in Fig. 2A.

A ROC curves for the diagnostic ability of MPV, PDW and Albumin for MDD (MDD vs. healthy controls). PDW: AUC 0.804 (95% CI = 0.791 to 0.810), P < 0.001; Albumin: AUC 0.742 (95% CI = 0.735 to 0.749), P < 0.001; MPV: AUC 0.693 (95% CI = 0.686 to 0.701), P < 0.001. B Risk factors of MDD nomogram. (Code of sex, 1: male, 2: female) (To use the nomogram, an individual patient's value is located on each variable axis, and a line is drawn upward to determine the number of points received for each variable value. The sum of these numbers is located on the Total Points axis, and a line is drawn downward to the Risk of MDD axes to determine the MDD risk). MDD: major depressive disorder; AUC: area under the ROC curve, MPV: mean platelet volume; PDW, platelet distribution width
In the binary logistic regression analysis in MDD, the disease state was used as the dependent variable, and age, sex, MPV, PDW and albumin were used as covariates, the forward conditional method was employed. Collinearity diagnostics showed that the largest value of variance inflation factor (VIF) was 1.255, suggesting that there was no obvious collinearity between the variables. The results showed that age, sex, MPV, PDW and albumin (P < 0.001) were independent indicators for MDD (Table 7). Nomogram was applied to predict the risk of MDD using a combination of multiple indicators. The data are shown in Fig. 2B.
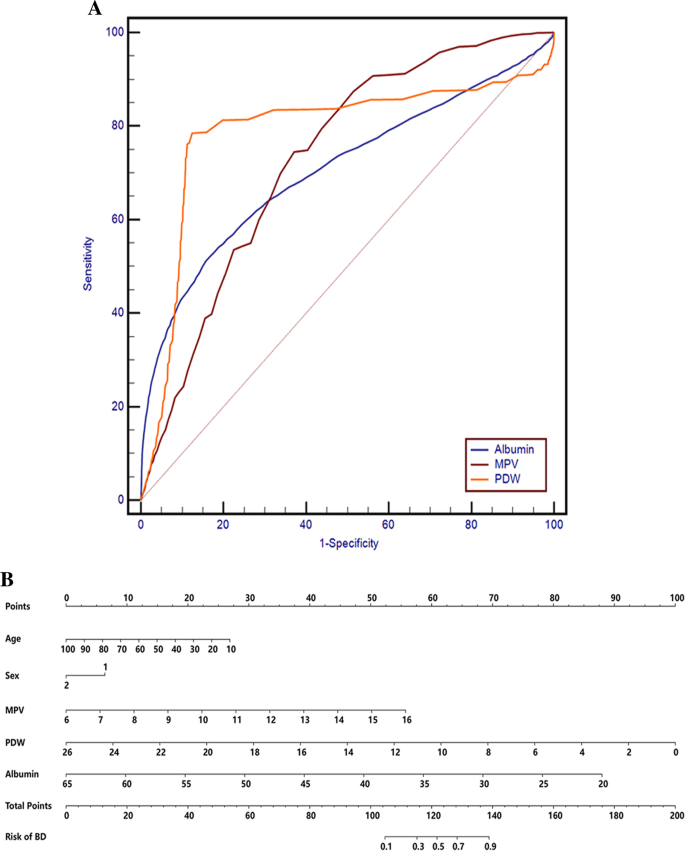
The ROC curve analysis for the diagnosis of BD (Fig. 3A) showed that the parameters with AUCs higher than 0.7 were MPV, PDW and albumin, the AUCs of other variables were lower than 0.6. A cut-off value of 15.5% for PDW (AUC: 0.789, 95% CI: 0.781–0.0.796, P < 0.001) differentiated patients with BD from healthy controls with a sensitivity of 78.45% and a specificity of 87.62%. An MPV cut-off point of 8.8 fL (AUC: 0.731, 95% CI: 0.723–0.739) which showed 74.45% sensitivity and 62.92% specificity was the optimal cut-off point to differentiate patients with BD from healthy controls. Furthermore, an albumin cut-off point of 43.3 g/L which displayed 51.17% sensitivity and 84.26% specificity, and with the AUC 0.708 (95% CI: 0.699–0.716) was the optimal cut-off point for the identification of BD.

A ROC for the diagnostic ability of MPV, PDW and Albumin for BD (BD vs. healthy controls). ROC curves for MPV, PDW and Albumin values for the diagnosis of BD. PDW: AUC 0.789 (95% CI = 0.781 to 0.796), P < 0.001; MPV: AUC 0.731 (95% CI = 0.723 to 0.739), P < 0.001; Albumin: AUC 0.708 (95% CI = 0.699 to 0.716), P < 0.001. (B) Risk factors of BD nomogram. (Code of sex, 1: male, 2: female) (To use the nomogram, an individual patient's value is located on each variable axis, and a line is drawn upward to determine the number of points received for each variable value. The sum of these numbers is located on the Total Points axis, and a line is drawn downward to the Risk of BD axes to determine the BD risk). BD: bipolar disorder; AUC: area under the ROC curve, MPV: mean platelet volume; PDW, platelet distribution width
The binary logistic regression analysis in BD, with disease state as the dependent variable, and age, sex, MPV, PDW and albumin as covariates, used the forward conditional method. Collinearity diagnostics showed that the largest value of the variance inflation factor (VIF) was 1.205, suggesting that there was no obvious collinearity. The results demonstrated that the age, sex, MPV, PDW and albumin (P < 0.001) were independent contributing factors for the occurrence of BD (Table 7). Nomogram was applied to predict the risk of BD using a combination of multiple indicators. The data are shown in Fig. 3B.

Comments
Post a Comment